Node Diagnostics
Open verified_user Admin Area > build System > monitor_heart Health Checks, then the arrow beside a provider or a relay name.
What the diagnostic reads
The diagnostic combines three sources, in this order:
The HAProxy statistics: the entry points, the nodes each one serves and the port it uses.
Each node, directly: its container engine for a Swarm cluster, its api server for Kubernetes.
The cluster’s own node list, asked of a node the probes have just confirmed as healthy.
The third source is never asked of the load balancer. A load balancer spreads calls over the machines it serves, so one call in three would reach the failed machine. Reemo therefore queries a healthy node directly.
The stats port
Reemo reads the statistics over HTTP, on the cluster host, port 8404 by default. For another port, fill in the HAProxy stats port field of the relay or of the cluster configuration. Each cluster keeps its own value that way.
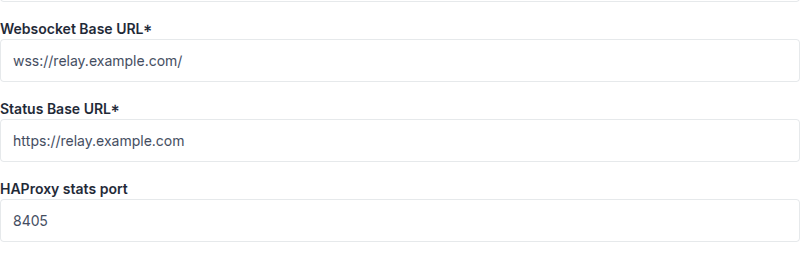
On a websocket relay, in verified_user Admin Area > shield Network & Security > settings_ethernet Websocket Relays
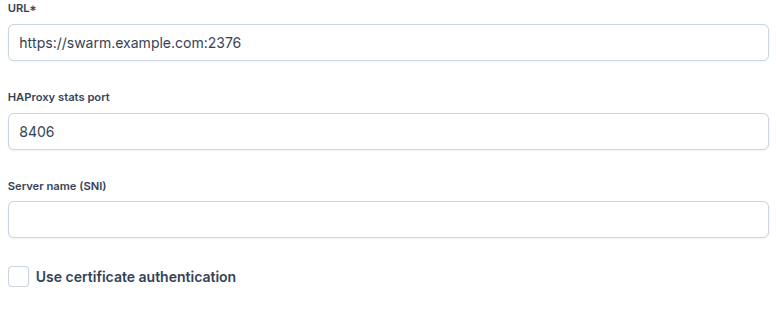
On a container provider, in verified_user Admin Area > view_in_ar Containers & Workstations > dns Container Providers, under Cluster Configurations
A statistics page opened at the lowest privilege level is enough. Do not grant the administrator level: it also allows enabling and disabling servers. HAProxy reserves each server’s address for that level, but Reemo names its servers after the address they serve and recovers the address from that name.
Note
Leave the field empty if HAProxy publishes its statistics on 8404. A value outside the 1-65535 range is ignored, and the default port applies.
Relays and container providers
A websocket relay must stand behind a load balancer, since that is how a client reaches it. Unreadable statistics are therefore a fault, and no node can be reported.
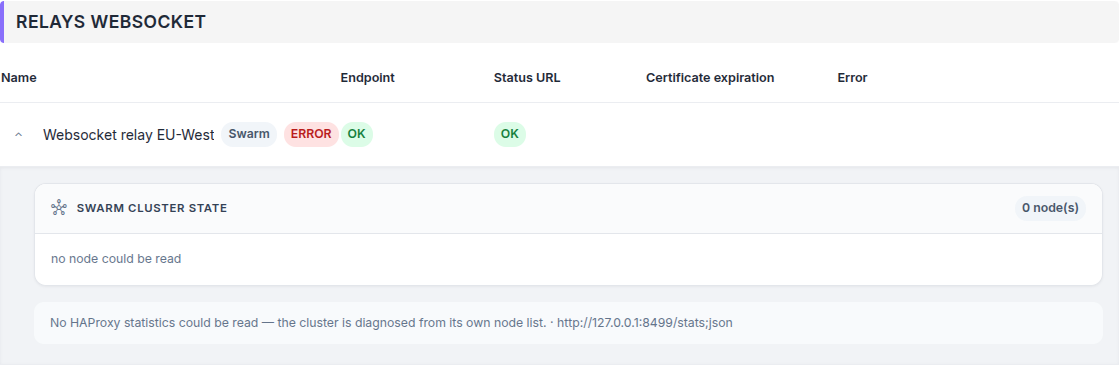
A relay whose statistics could not be read: the verdict is ERROR and no node is listed
A container provider may have nothing in front of it. Its statistics are read as a best effort: with no inventory, the diagnostic uses the cluster’s own node list and says so under the table.
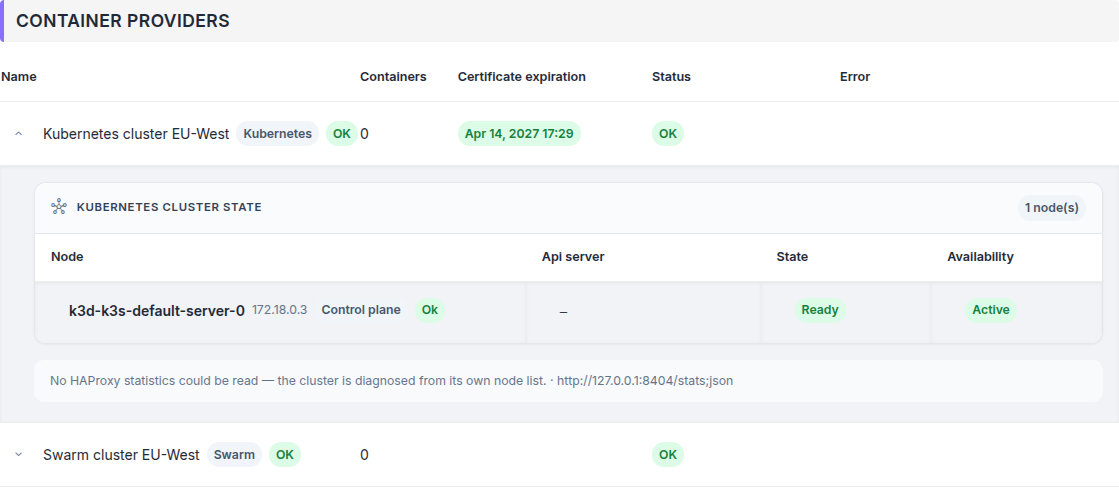
A Kubernetes cluster with no load balancer in front of it, diagnosed from its own node list
The node table
The first card of the panel lists the nodes. Its columns depend on the type of cluster.
Columns of a Swarm cluster
Column |
Content |
|---|---|
Node |
Host name, address, role and state, plus a warning when the node sits outside the load balancer pool. |
Engine |
Version of the container engine the node reported. |
Swarm |
Whether the engine has an active swarm. |
State |
State the cluster gives this node. |
Availability |
Whether the cluster schedules work on it: Active, Pause or Drain. |
Reachability |
Whether the other managers reach this node. |
Columns of a Kubernetes cluster
Column |
Content |
|---|---|
Node |
Host name, address, role and state, plus the same warning about the pool. |
Api server |
Whether the api server answered at that address, and with which code. |
State |
Whether the cluster reports the node as ready. |
Availability |
Whether the cluster schedules work on it. |
A dash marks a value that was not read. A Kubernetes node is probed at its own address only if the load balancer names it, because it does not answer on the api server’s port. Its readiness then comes from the cluster’s node list, and the Api server column shows a dash.
The role determines whether a node must be served by the load balancer. A Manager and a Control plane node must be. A Worker does not have to be: it carries a warning, without turning the verdict into an error.
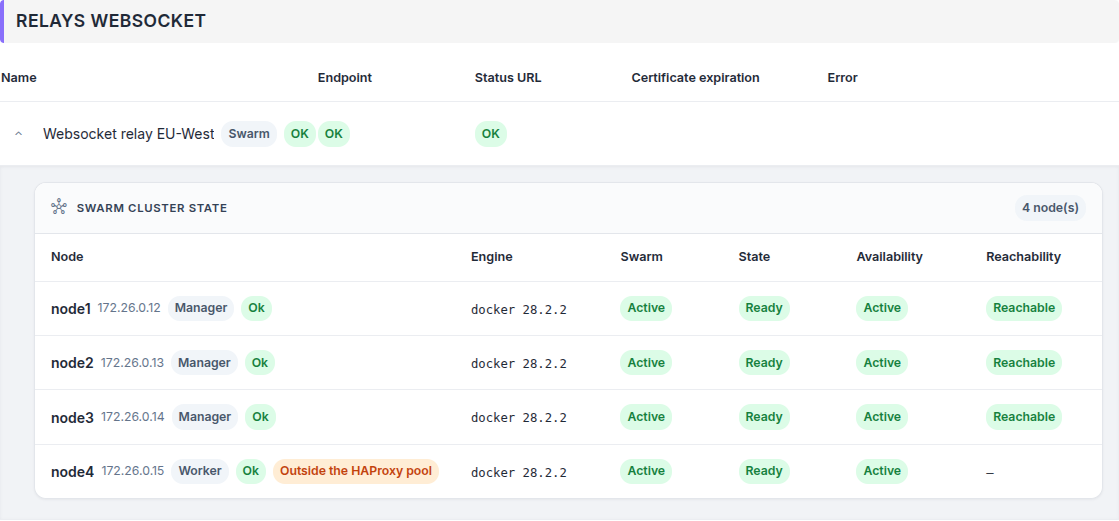
node4 is a worker: it is outside the pool, and that is normal
Node states
The badge beside a node name gives its state. Hover it to read the detail that led to that state.
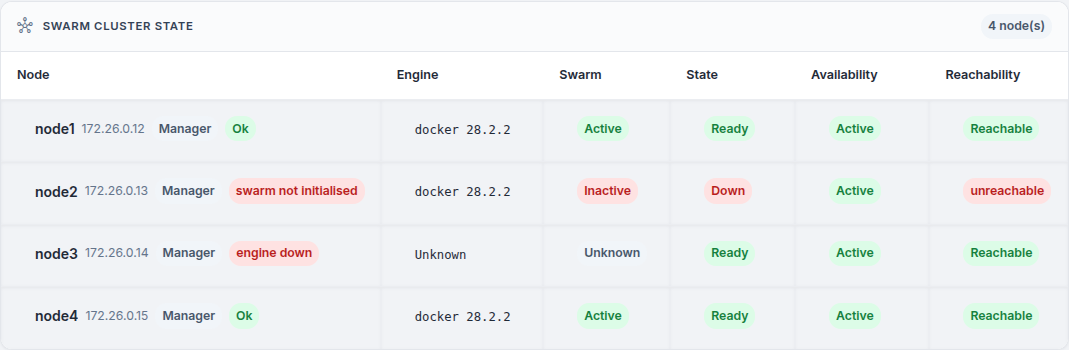
Three states in one cluster: an engine that no longer answers, a node that left the swarm, and two healthy nodes
States of a Swarm node
State |
Meaning |
Where to look |
|---|---|---|
Ok |
The node answers and belongs to the cluster; the load balancer serves it as its role requires. |
Nothing to do. |
nginx unreachable |
Nothing answered at the node’s address. |
The machine, or the socket proxy in front of its engine. |
engine down |
The socket proxy answers, but the engine behind it returns a server error. |
The container engine on that machine. |
swarm not initialised |
The engine answers but is not part of any swarm. |
The node left the cluster, or was never joined to it. |
outside the cluster |
The engine belongs to another cluster, or this cluster does not list the node. |
A node joined to the wrong cluster, or an entry left behind in the load balancer. |
not served by the proxy |
No entry point serves this node, although its role requires one. |
The load balancer configuration. |
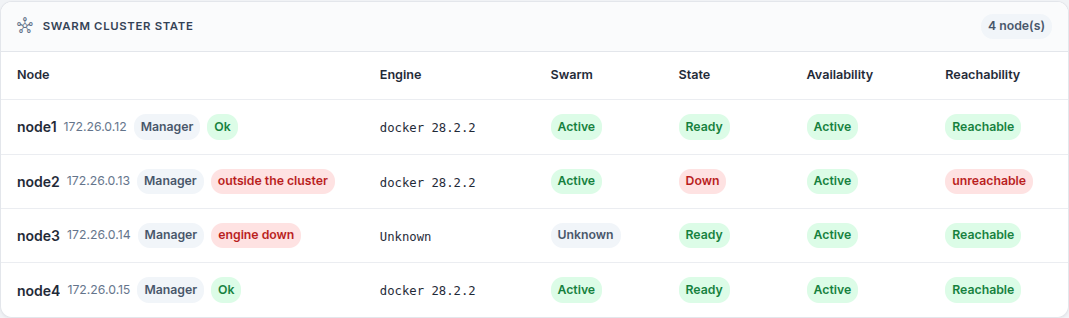
node2 answers, but its engine has been joined to another cluster
States of a Kubernetes node
State |
Meaning |
Where to look |
|---|---|---|
Ok |
The node is listed as ready; the load balancer serves it as its role requires. |
Nothing to do. |
unreachable |
Nothing answered at the address the load balancer reported. |
The machine, or the entry point in front of it. |
api server down |
The api server returns a server error. |
The control plane on that machine. |
not ready |
The cluster reports the node as not ready. |
The kubelet and the node’s own conditions. |
outside the cluster |
The cluster does not list this node. |
An entry left behind in the load balancer. |
not served by the proxy |
No entry point serves this control plane node. |
The load balancer configuration. |
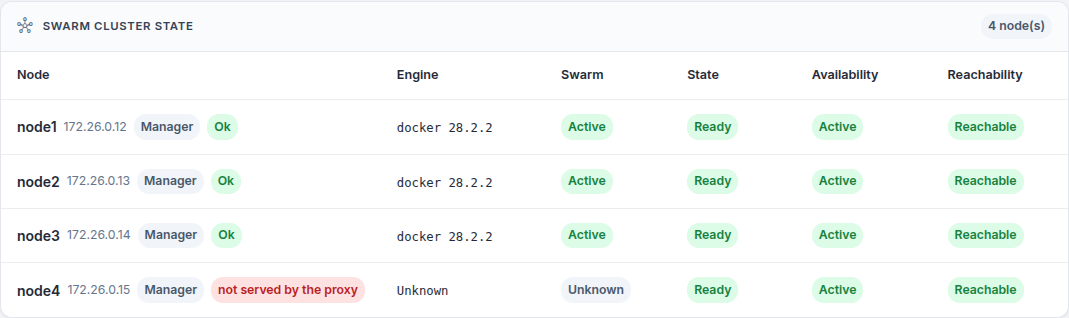
node4 was promoted to manager, and no entry point was ever added for it
Some states belong to one type of cluster: nginx unreachable, engine down and swarm not initialised exist only for Swarm; unreachable, api server down and not ready only for Kubernetes.
The not served by the proxy state also depends on the family. A websocket relay reports it as soon as a manager is missing from the load balancer, since that is the only way to reach it. A container provider on a Swarm cluster probes the machines the cluster names, even when the load balancer ignores them, so a manager that answers reads Ok. On a Kubernetes cluster, where a node cannot be probed at its own address, the load balancer’s inventory becomes the only evidence again and the state applies.
The cluster verdict
The badge beside the cluster name summarises its nodes:
ERROR: a node that should be serving traffic is not, or the cluster’s node list could not be read.
WARNING: a node that is not expected to serve traffic is in an unexpected state, or a node is served by only part of the pools it belongs to.
OK: none of the above.
not available: the diagnostic could not be run. The appliance carrying the cluster is offline, or the service that performs the diagnostic has not been updated yet.
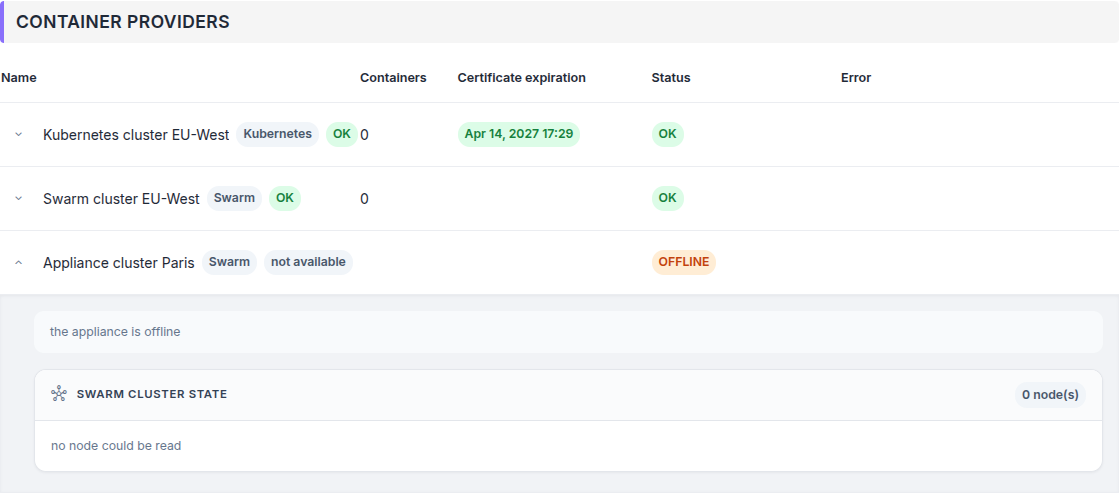
An offline appliance: the diagnostic is not available, and no conclusion is drawn
A node served by some entry points but missing from the others deserves particular attention. On the screenshot below, every node reads Ok and the verdict reads WARNING: node4 is a manager, it appears in its own entry point, and it is missing from the three pools its peers share. No traffic reaches it.
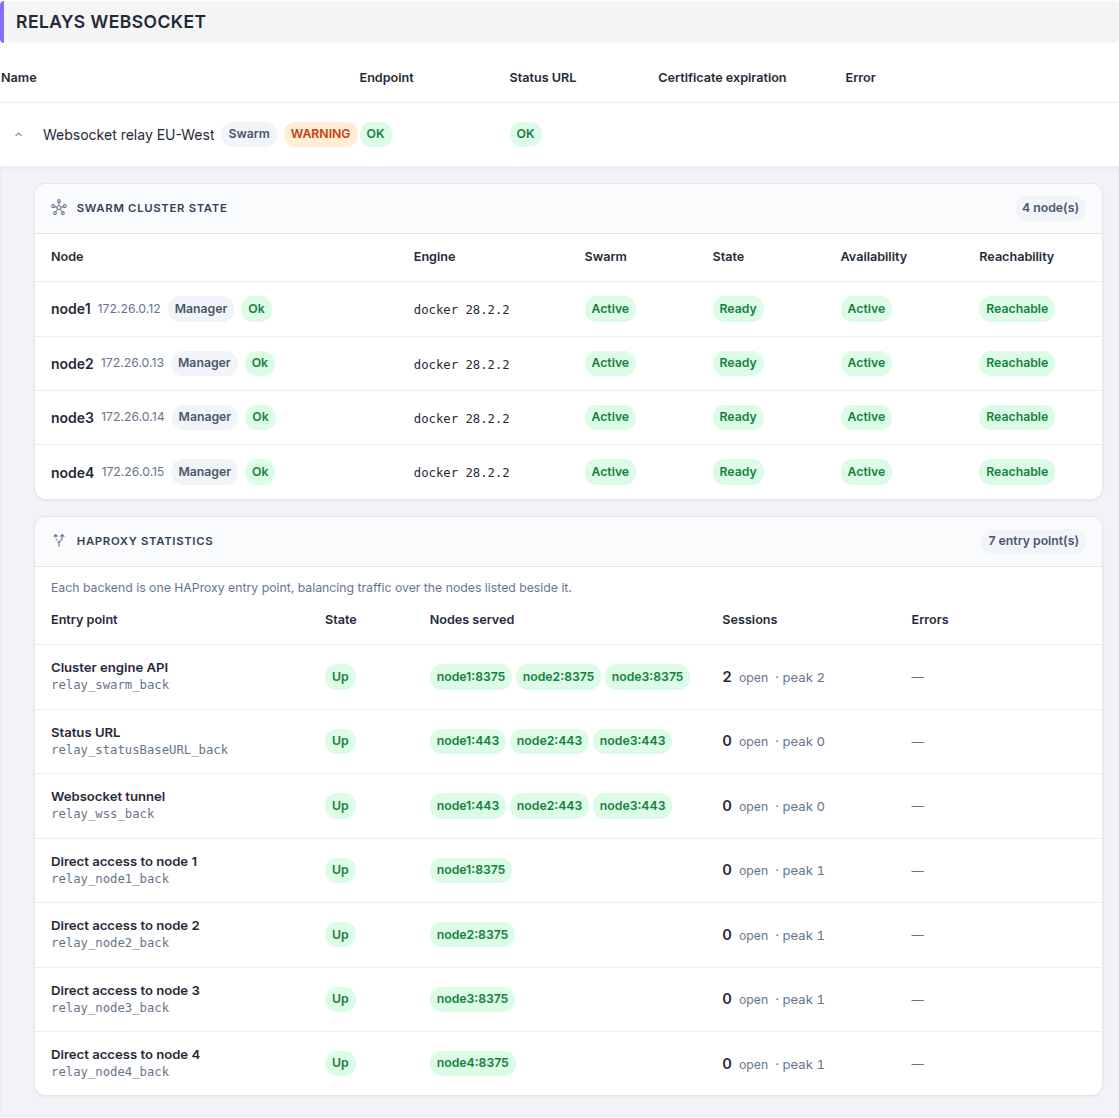
A node plugged into part of the load balancer only
Note
An entry point serving a single node gives direct access to that node. It is not a pool, and is left out of this calculation.
When the cluster’s node list cannot be read, each node keeps the state its own probe deserved and the cluster reads ERROR: without that list, membership and roles remain unknown, and no node can be cleared.
The HAProxy statistics
The second card of the panel reports the load balancer, one line per entry point.
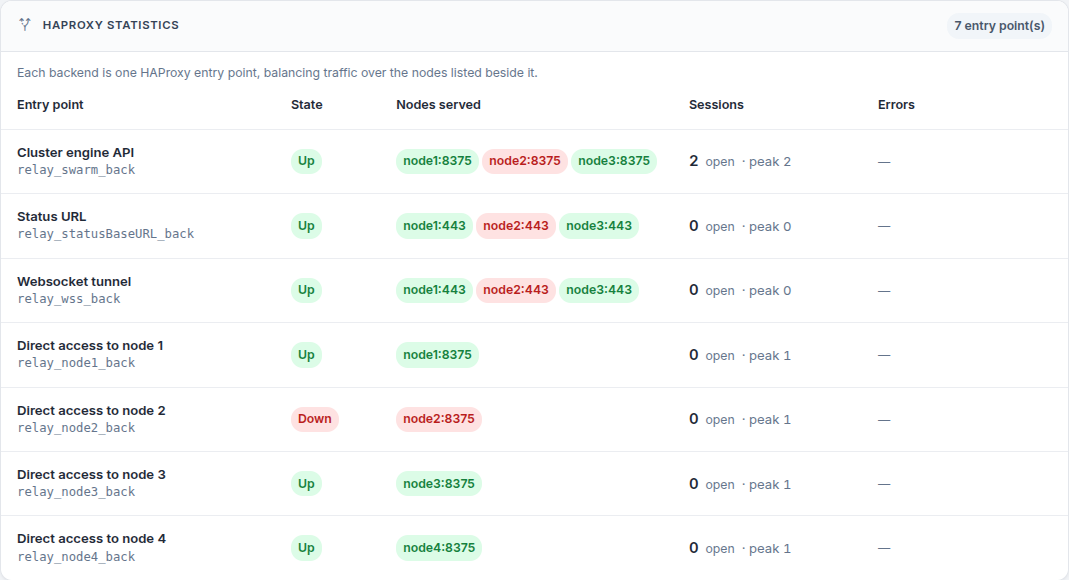
The entry points of a relay, one node being down
Column |
Content |
|---|---|
Entry point |
The role read from the backend name, with the raw name below it. That role follows the naming convention: check it against the raw name. |
State |
The state HAProxy gives this entry point as a whole. |
Nodes served |
The nodes it balances over, with the port it uses. In red, a node HAProxy has taken out of the pool. |
Sessions |
Connections open right now, and the highest number reached since HAProxy started. |
Errors |
Failed connections to a node, invalid responses, and connections retried elsewhere. |
Warning
The Errors counters are cumulative since HAProxy started and are never reset. A number there does not mean an incident is in progress, and a dash means no counter has moved since that start. Compare them with the Sessions peak to interpret them.
Where to start
A node in error while the entry point still answers means the service survived on the remaining machines. In order:
Read the state of the node and its tooltip: they name the layer that failed.
Check that node in the Nodes served column. If HAProxy has taken it out of the pool, traffic already avoids it.
Repair the layer concerned, then click Refresh: the diagnostic is taken again from scratch.
See also
Health Checks — the page these diagnostics are opened from.