Health Checks
The page does not refresh on its own: every value is read when the page opens, or when you click Refresh, at the top right.
Overview
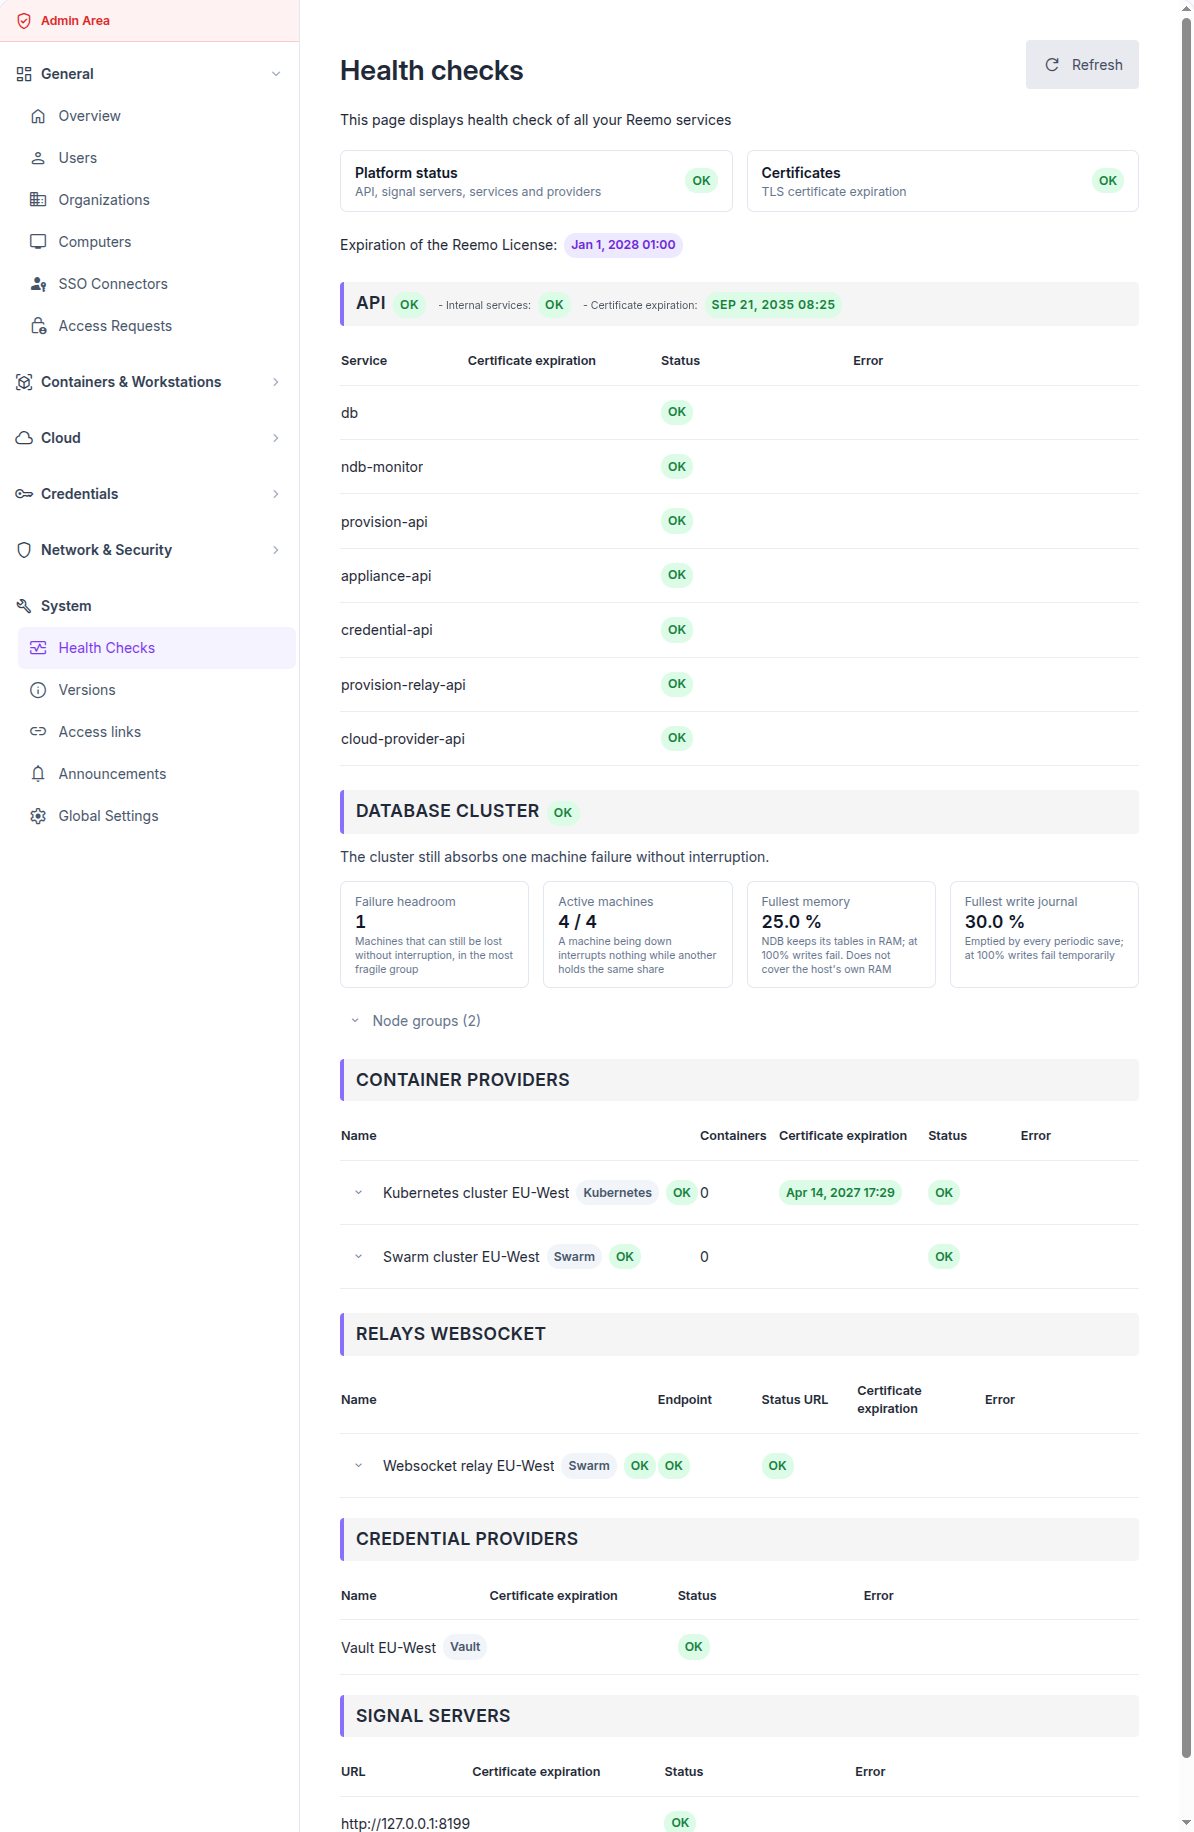
The Health Checks page on an operational platform
The page is organised as follows:
Two tiles summarise the platform and the TLS certificates it uses.
One section per family of services lists each entry with its status and, on failure, its error.
A Node details button opens, for a container provider or a websocket relay, the state of each node of the cluster.
Platform status and certificates
Hover a tile to list what brought it out of the OK state.
Platform status covers the API, the signal servers, the internal services and the providers:
ERROR: the API does not answer, or one of its internal services is down, or every signal server is down.
WARNING: some signal servers are down, or at least one provider is in error, or the database cluster is degraded while still serving.
OK: none of the above.
Certificates covers every TLS certificate the page knows about, against two thresholds set on the instance:
ERROR: a certificate could not be read, or expires within the error threshold.
WARNING: a certificate expires within the warning threshold.
OK: every certificate is readable and outside both thresholds.
Note
A cluster with nodes in error does not turn the Platform status tile: as long as the cluster answers through its entry point, the service stays available. Only the node diagnostic reports it.
Detailed sections
APIs
This section groups the internal services Reemo needs to operate. Its heading shows three pieces of information: the status of the API, the status of the Internal services, and the expiration of the API certificate.
The status of the API alone turns to error when the database is unreachable. The other services in the table feed the Internal services status:
db: the database,
provision-api: container provisioning,
provision-relay-api: websocket relay provisioning,
credential-api: credential providers,
cloud-provider-api: Cloud Provider integrations,
appliance-api: appliances registered on the instance.
Database cluster
This section appears on an instance whose database runs on a MySQL NDB Cluster, and whose supervision service is enabled. It shows how much failure the cluster can still absorb.
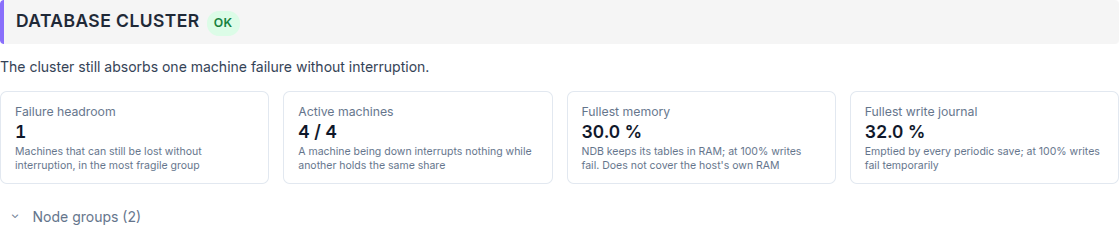
A healthy database cluster
Failure headroom: the number of machines that can still be lost without interrupting the service, counted in the most fragile group.
Active machines: live data machines out of the total.
Fullest memory: NDB keeps its tables in RAM; at 100 % writes fail.
Fullest write journal: emptied by every periodic save; at 100 % writes fail temporarily.
A sentence above the tiles summarises the situation. Below it, each reason names one fault, with its technical detail in grey. Node groups lists each group, the machines it holds and the number of copies still live.
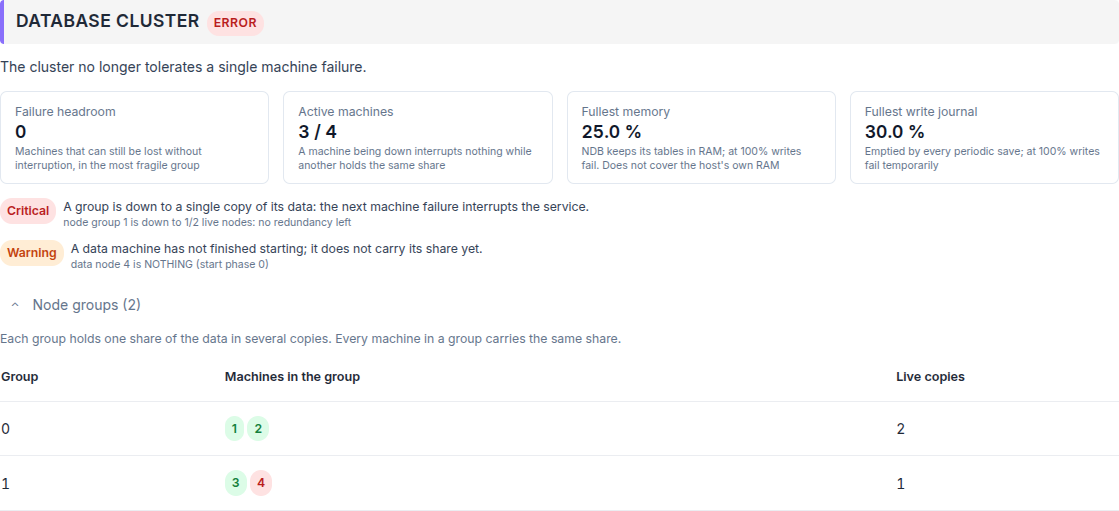
A cluster that no longer tolerates a single machine failure
Note
A degraded cluster still serves: the service stays OK in the table above. The nuance appears in this section’s badge and in the Platform status tile, which reads WARNING.
Container Providers
This section lists the container clusters configured on the instance, one row per cluster. Each row carries the provider name and its type, the number of containers it runs, the expiration of its certificate, its status and its error.
Relays websocket
This section lists the websocket relays, one row per relay. Endpoint and Status URL are probed separately: a relay answers on its cluster endpoint to be managed, and on its status URL to be reached by a client.
Credential Providers
This section lists the credential providers configured on the instance, with the status returned by each vault.
Signal servers
Signal servers establish the WebRTC connections between users and resources. Each row shows the server URL, the expiration of its certificate and its status.
Node details
A container provider and a websocket relay each stand in front of a cluster of several machines. The status columns of their tables report the cluster as a whole, through its entry point: a cluster that has lost a node therefore keeps answering and keeps reading OK.
The badge beside the name reports the cluster node by node. The arrow before it opens the detail.
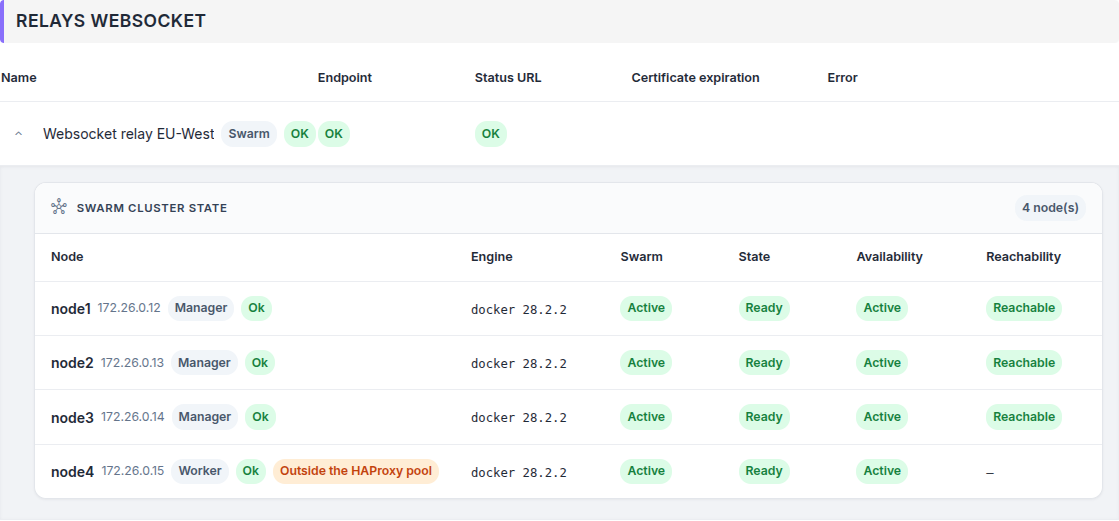
A relay whose four nodes are all operational
On the screenshot below, Endpoint and Status URL are both OK, because HAProxy keeps routing to the surviving nodes. The badge reads ERROR because one node stopped answering.
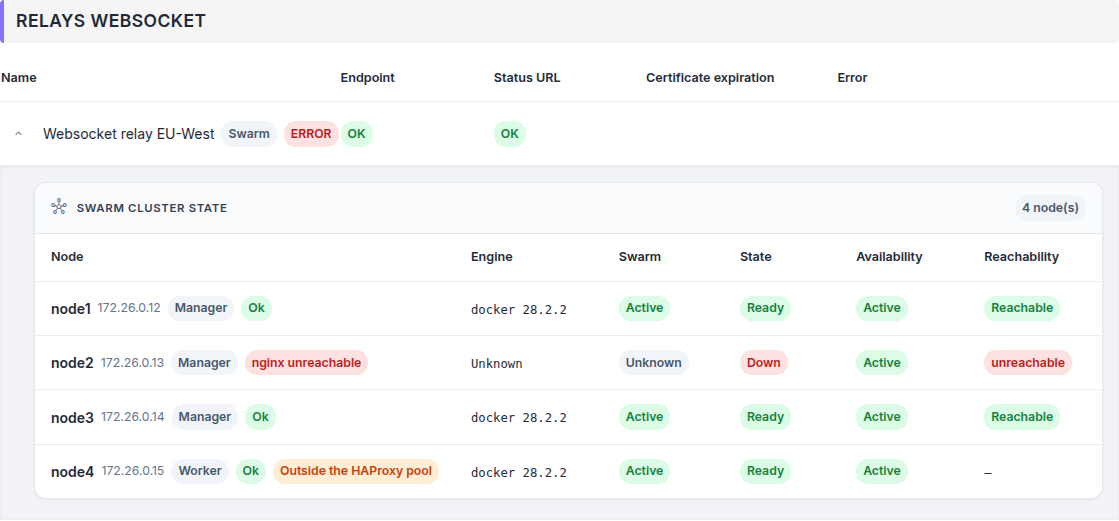
One node down behind a relay that still answers
The badge takes four values:
OK: every node is in the state its role requires.
WARNING: a fault without loss of service, on a node no traffic is expected of.
ERROR: at least one node that should be serving traffic is not.
not available: the diagnostic could not be run, for instance while an appliance is offline.
See also
Node Diagnostics — every node state, the aggregation rules, and how to read the HAProxy statistics.
Operation
Refresh the page with the Refresh button, at the top right.
When a service fails, the Error column gives the reason. Hover it to read the full text and copy it.
Consult this page regularly: it reports a certificate close to expiration, a service that stopped, or a cluster that lost its redundancy.